My Trade Examples

September 2018 Week 3: The trades shown here are for instructional purposes only. The weekly spread trades occurred in the prior week and are now closed. Investors are responsible for Trade Comments:
| Date Entered | Symbol | Position | Exit Date | % Profit/Loss on Acct Bal | Comments |
| Directional Trades on Standard Options | |||||
| 9/11/2018 | SPY | BC 19OCT18 288 SP | 9/17/2018 | -0.12% | Took trade based on Buy-Signal day on 9/11/18 and share price bouncing off 21-day ma support. Exited the trade when share price began to drop sharply. An alternative would have been to exit 1/2 my posistion on 9/17 and placing my stop below the 21-ma support. A good time to take remaining profit would have been on 9/21 based on the Sell-Signal day and bearish hammer candlestick on 9/20. |
| 9/20/2018 | SWKS | BC 16NOV18 87.5 SP | OPEN | ||
| Total Monthly Profits on Directional Trades: | -0.12% | ||||
| # Monthly Directional Trades: | 1 | (Closed Trades Only) | |||
| # Monthly Profitable ades: | 0 | ||||
| Monthly Percent Profitable on Directional Trades: | 0.00% | ||||
| Date Entered | Symbol | Position | Exit Date | % Return on Entire Acct . Bal. | Comments |
| Vertical Spreads on Weekly Options July Week | |||||
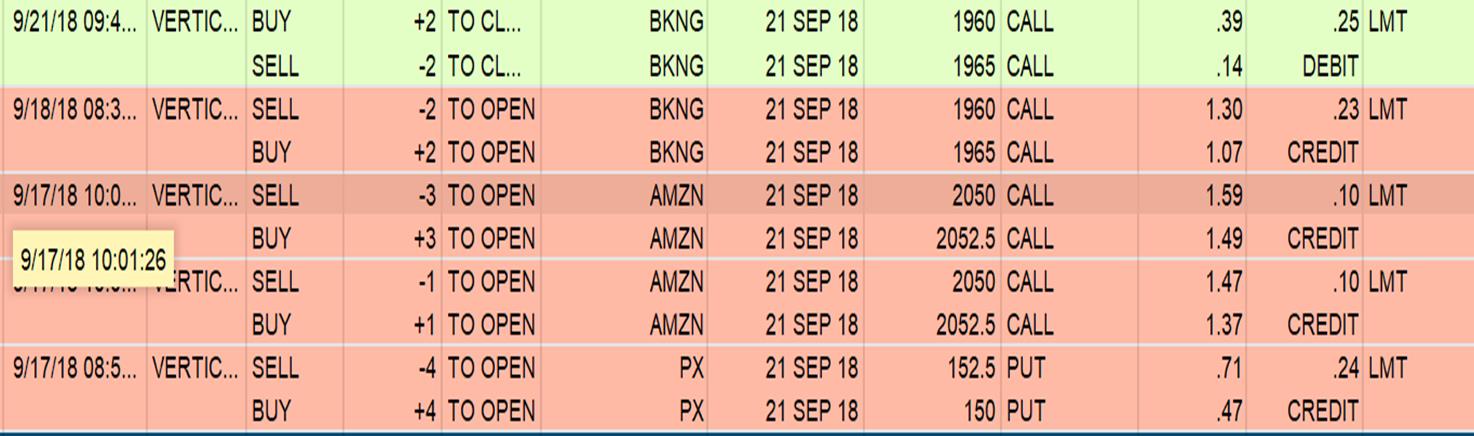
| 9/17/2018 Bull Put | PX | SP 21SEP18 152.5 SP BP 150 SP | EXPIRED | 0.85% | Entered trade based on a Buy-Signal day on 9/11, bullish Harami candlestick pattern on 9/14 & 17 and share price price bouncing off the 21-ma. Strike prices below the 21-moving average and well below the lower Bollinger Band giving us a 2 defense line, no brainer trade. |
| 9/17/2018 Bear Call | AMZN | SC 21SEP18 2050 SP BC 2052.5 SP | EXPIRED | 0.32% | Entered trade based on a Sell-Signal day on 9/14, share price breaking strongly through the 21-day moving average and bearish Hammer candlestick on 9/12 Strike prices were above the 21-day ma and upper Bollinger Band giving us a 2 defense line, no brainer trade. |
| 9/17/2018 Bear Call | BKNG | SC 21SEP18 1960 SP BC 1965 SP | 9/21/2018 | -0.06% | Entered trade based on a Sell-Signal day on 9/10 & 9/17, bearish Hammer candlestick on 9/24, Bearish Engulfing candlestick pattern and share price breaking below the 21-ma on day of trade. Strike prices were above the 21-day ma and the upper Bollinger Band giving us a 2 defense line, no brainer trade. The following day, share prices began to move higher. On Friday share price moved above my short call (call I sold) for a short time and then immediately began to drop strongly moving back below it. The share price movement was favorable for our trade and would have resulted in a profit, however, I exited with a small loss when the share price began to rally upward again, to avoid a potentially larger loss (see discussion on exiting a trade that is moving against you). |
| Total Monthly Profits on Weekly Spread Trades: | 1.11% | YTD Directional Trades Percent Profit on Entire Account Balance: 25.71% | |||
| Total Monthly Profit on All Trades: | 0.99% | YTD Weekly Spread Trades Percent Profit on Entire Account Balance: 13.85% | |||
| # Weekly Spread Trades: | 3 | YTD All TradesTotal Percent Profit on Entire Account Balance: 39.56% | |||
| Profitable Trades: | 2 | YTD Percent Profitable Directional Trades: 71.92% | |||
| Percent Profitable Trades: | 66.67% | YTD Percent Profitable Weekly Spread Trades: 89.66% | |||
Broker Statement
Quick Contact

Create Consistent Weekly Income That Can Change Your Life.
Dallas, Texas, USA.
Links
Trading Library


Get In Touch
I look forward to teaching you how to generate weekly income through investing in stock options using my exclusive strategy.
- David Miles
Follow Us


2018 © All Rights Reserved Cash From Options
Designed by Mobile Marketing Helper