
Understanding a Candlestick
We’ll use a daily chart for this example.
- Your stock chart will show price data that shows the open, high, low and close price for each day.
- The hollow or filled portion of the candlestick is called “the body”.
- The thin lines above and below the body represent the high/low price range and are called “wicks” (also referred to as “shadows” and “tails”).
- The high price of the day is marked by the top of the upper wick and the low price of the day by the bottom of the lower wick.
- If the stock price closes higher than its opening price, a hollow or green candlestick is drawn with the bottom of the body representing the opening price and the top of the body representing the closing price.
- If the stock price closes lower than its opening price, a red candlestick is drawn with the top of the body representing the opening price and the bottom of the body representing the closing price.
Candlestick charts are more visually appealing and easier to interpret than traditional charts. Each candlestick provides an easy-to-understand picture of price action.
- Immediately a trader can compare the relationship between the open and close as well as the high and low.
- The relationship between the open and close is considered vital information and forms the essence of candlesticks.
- Hollow or green candlesticks, where the close is higher than the open, indicate buying pressure.
Filled or red candlesticks, where the close is lower than the open, indicate selling pressure.

Long Versus Short Bodies
Generally speaking, the longer the body is, the more intense the buying or selling pressure.
Conversely, short candlesticks indicate little price movement and represent consolidation or indecision.
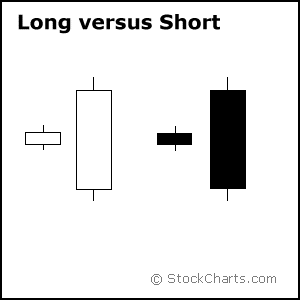
- Long hollow or green candlesticks show strong buying pressure.
- The longer the body of the hollow or green candlestick is, the further the close is above the open and indicates that prices advanced significantly from open to close and buyers were aggressive.
- While long hollow or green candlesticks are generally bullish, much depends on their position within the broader technical picture.
- After extended declines, long white candlesticks can mark a potential turning point or support level. If buying gets too aggressive after a long advance, it can lead to excessive bullishness.
- Long red or black candlesticks show strong selling pressure.
- The longer the red or black candlestick is, the further the close is below the open, indicates that prices declined significantly from the open and sellers were aggressive.
- After a long advance, a long red or black candlestick can foreshadow a turning point or mark a future resistance level.
- After a long decline a long black candlestick can indicate panic or capitulation (buyers give up and begin selling).
Candlesticks are a short-range measure of stock price activity, usually covering only a single day or, in the case of candlestick combinations, a two or three-day period (see “Candlestick Patterns”. Candlesticks are a compact and precise measure of stock price movement. Their exactness, in fact, is what makes them so valuable. They reveal exactly where a stock opened, exactly where it closed, and exactly how high and low the price moved during the day. There is no need for guesswork.