
Support and resistance are rooted on the economic principle of supply and demand. Supply and demand is the market’s attempt to match supply (selling stocks) with demand (buying stocks) on the part of investors. If stock investors think that the stock’s price will fall they sell. Sellers are said to be “bearish”. If stock investors think the price will rise they buy. Buyers are said to be “bullish.” Horizontal support and resistance lines tend to occur at price levels at which supply and demand forces are in balance.
Support is the equivalent of a stock price “floor.” While a stock’s price may move up and down above the support line the price doesn’t move below the support line until the supply-demand balance for the given stock fundamentally changes. Support is the stock price level at which demand (or the inclination to buy) is presumed to be powerful enough that the stock’s price will not drop below that level and begin to rise. At least two price levels should be used to define support. The second price level will occur after prices have risen after bouncing off support and then fall back down to or near the former price level. Three or more price points indicate stronger support.
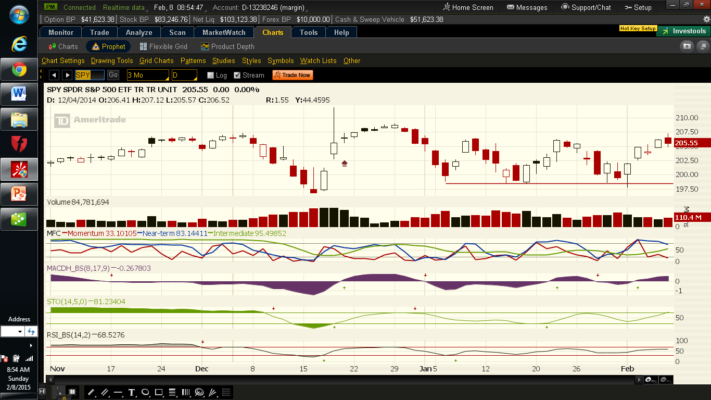
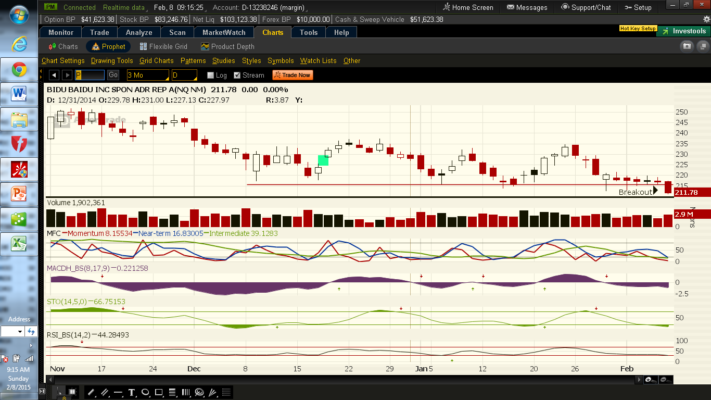
At some point in time, a stock price may move below and close beneath the support line. This is called “breaking support” or a “breakout” and indicates the price could move lower. What has happened in this case is that the former supply-demand balance has changed. If the price moves below the support line and then moves back and closes above the support line it is not a breakout.
Support Breakout
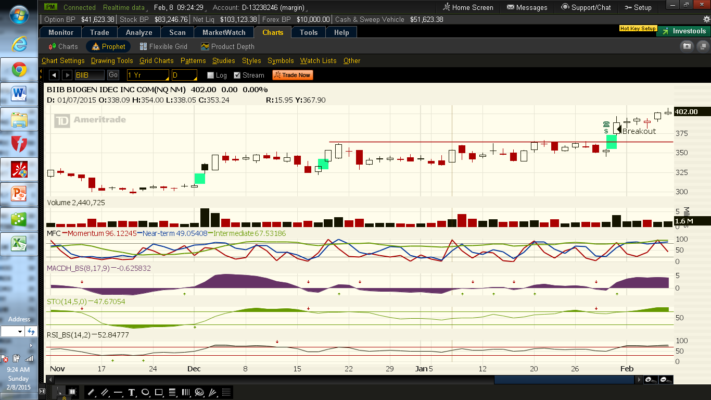
Resistance is the mirror image of support and acts as a stock price “ceiling”. While a stock’s price may move up and down below the resistance line the price doesn’t move above the resistance line until the supply-demand balance fundamentally changes. As with support, at some point in time a stock may pierce and close above the price ceiling. This is also called “breaking resistance” or a “breakout” indicating the price could move higher. At least two high price levels should be used to define resistance. Three or more price points indicate stronger resistance.
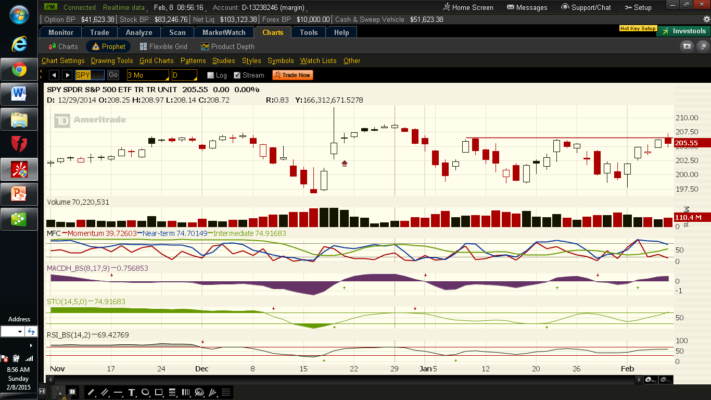
Resistance Breakout
One of the attributes of support and resistance analysis is that if the stock price moves and closes below support then support can later become resistance. For instance, assume a breakout occurs and the stock price has broken support and moved to a new low. Now assume that the stock rebounds and that its price begins to rise again. As it does, the stock is likely to meet resistance at the former support line because that line previously served as a balance point between supply and demand. Support has become resistance. It’s the opposite for resistance. If stock prices move above resistance the old resistance line can become support.